
Research Topics
Basin Effects and Sensitivity Kernels
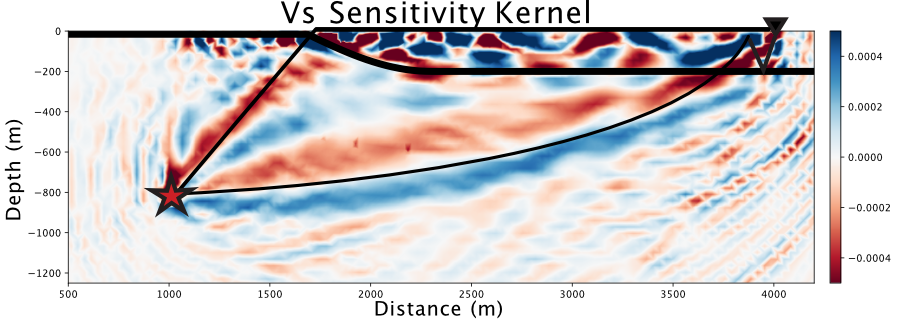
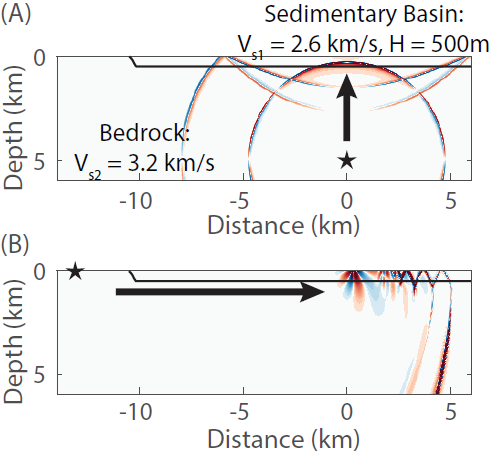
Which feature of a sedimentary basin is most responsible for amplifying seismic waves? Which part of the wavefield contributes the strongest shaking? We're exploring how finite-frequency sensitivity kernels can illuminate different parts of a velocity model. In the simple 2D example below, we can see both body waves and surface waves reach a surface station using different parts of the model. Adding further complications like topography, lateral basin resonances, additional layers, etc., lets us explore how these different aspects change the picture and how different features become more/less important.
Surface Wave Amplifications
In an effort to better explain observed site amplifications for seismic hazard, we describe a simple analytic amplification term for surface waves. The term considers conservation of energy between one 1D geologic profile and another, described in surface-wave literature but only now considered in a hazards context. The standard, textbook description of site effects considers a vertically incident SH-wave to determine amplifications and resonances; if a vertically-incident plane wave is one end-member simplification of reality, then our surface wave description is the other. Any seismic hazard estimate for which surface waves play an important role may be better described by this more appropriate site-term.
Bowden and Tsai (GRL, 2017)(PDF)
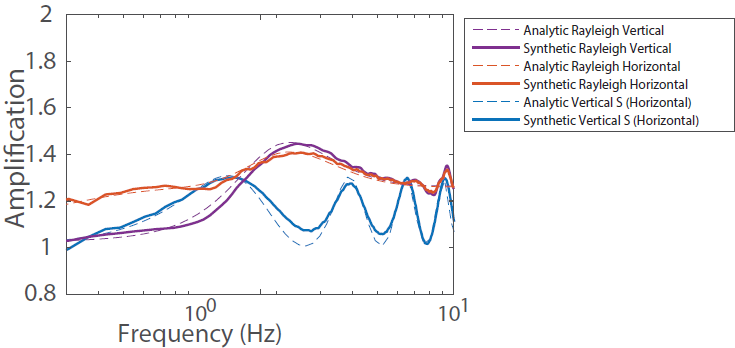
++ More recently, this theory was advanced by my colleague Quentin Brissaud, and extended to account for wave conversions and reflections at the basin edge. Now we're playing with Random Forests as a machine learning tool for surface wave amplification spectra, partly because it could be an interesting tool, but also because it can inform us about which basin parameterization (Vs30, Z10, basin-edge steepness, etc.) is most important. Brissaud, Bowden and Tsai (BSSA, 2020) (PDF)
Array Processing: Beamforming, Matched Field Processing and Source Inversion
I am always interested in finding the commonalities between various methods.
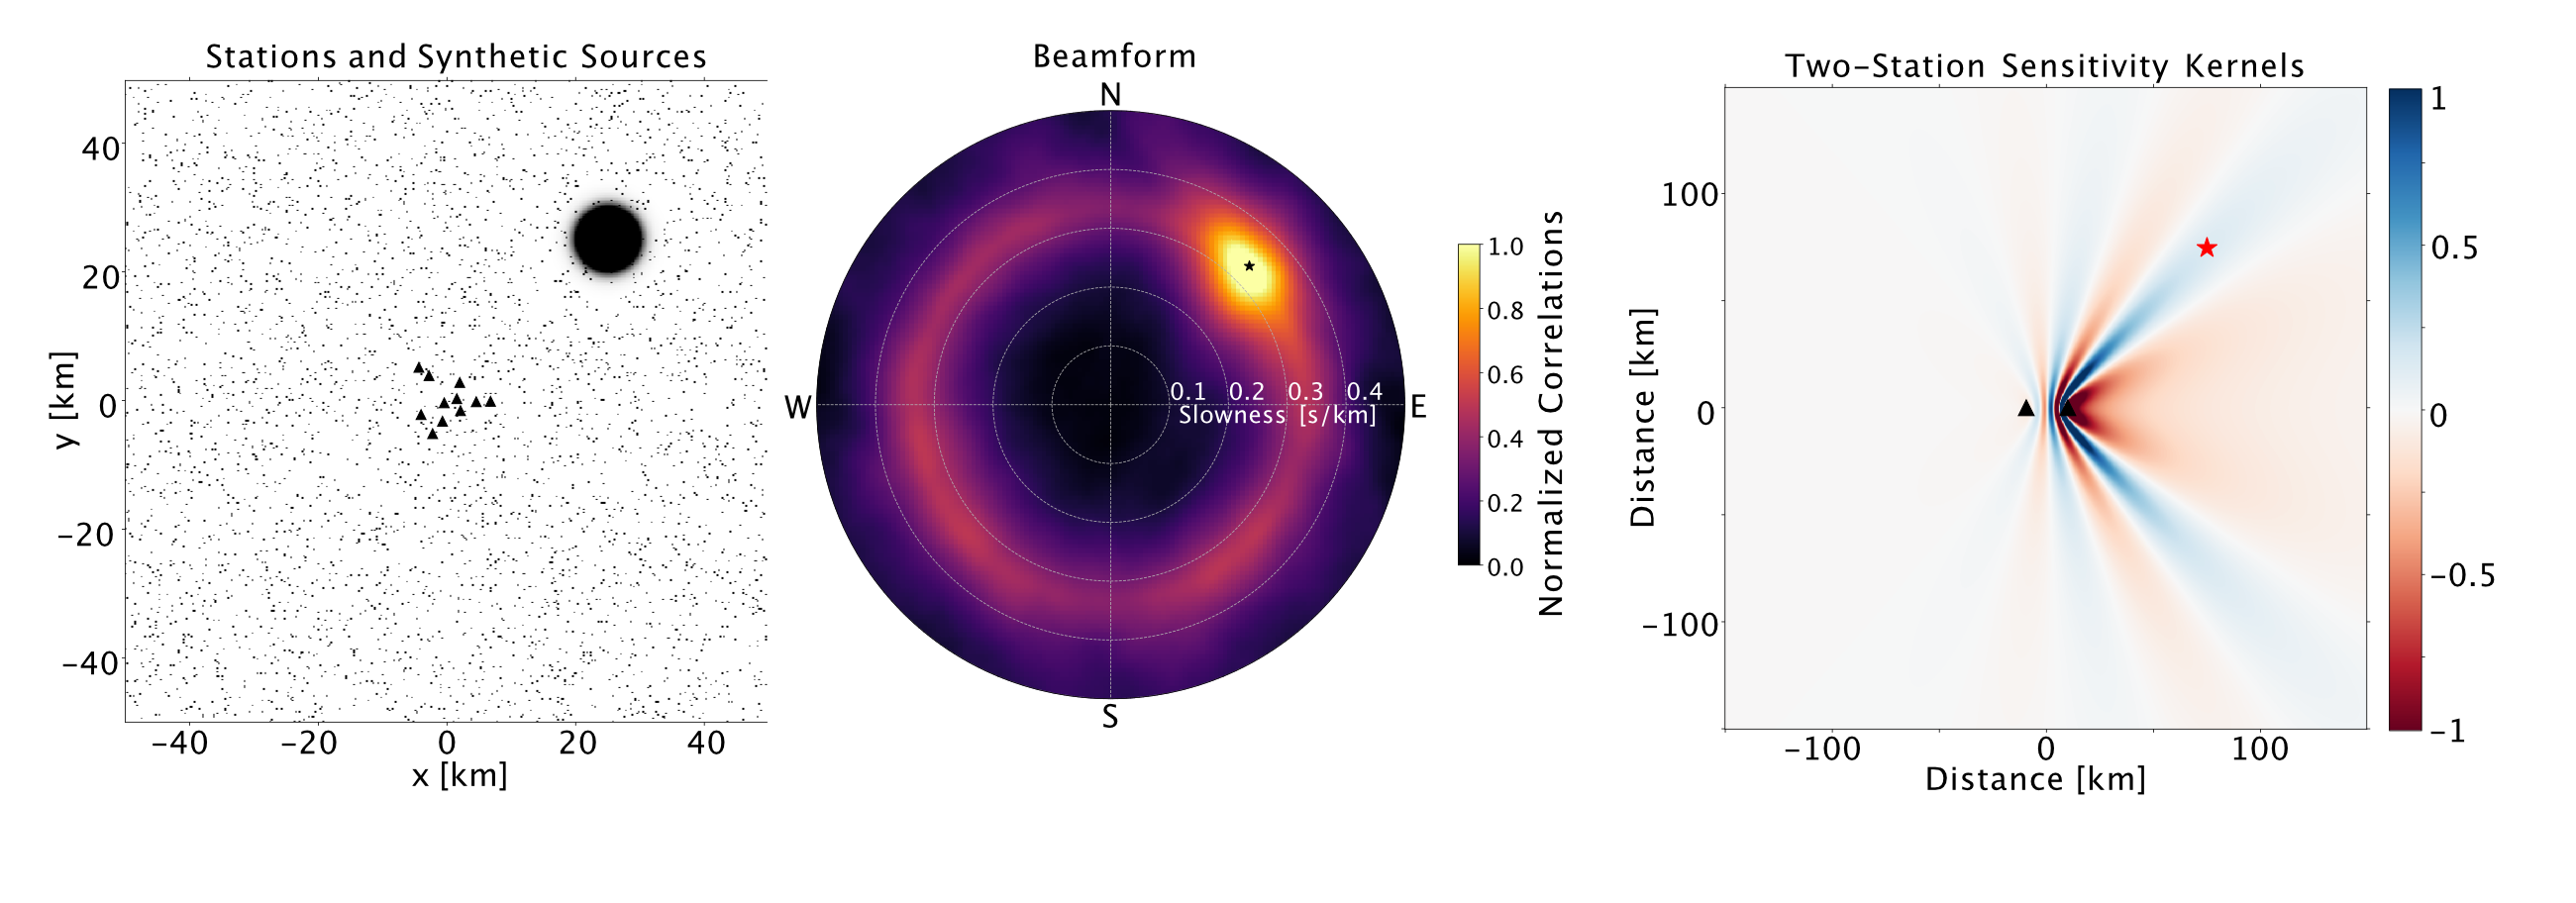
Beamforming methods use an array of sensors to determine which direction noise or earthquake sources might have originated, testing various timeshifts between the signals. Taking this one step further, Backprojection or Matched Field Processing methods actually gridsearch over some spatial domain to determine the timeshifts approrpiate for some noise or earthquake source in space. Along with colleague Korbinian Sager, I am exploring how these methods relate to the more mathematically rigorous (and computationally complex) adjoint-based iterative noise source inversion approach. I hope that bridging these two communities can improve methodologies on both sides, and I also hope that the work can serve as a "user-friendly" introduction to the inversion framework.
Bowden, Sager, Fichtner and Chmiel (GJI, 2020) (PDF)
Youtube Video we made as an abstract / teaser for the paper. Video editing help from Jonas Igel.
++ Also relating to beamforming: along with Monica Kohler and others, we used Ocean Bottom Seismometers offshore southern California to image Tsunami waveforms after the Tohoku Earthquake in 2011. We used the MUSIC algorithm to isolate different wavefronts moving across the array, and raytracing to point back to where such signals might have originated - not just the original epicenter, but showing significant scattering all around the Pacific for even 48 hours after.
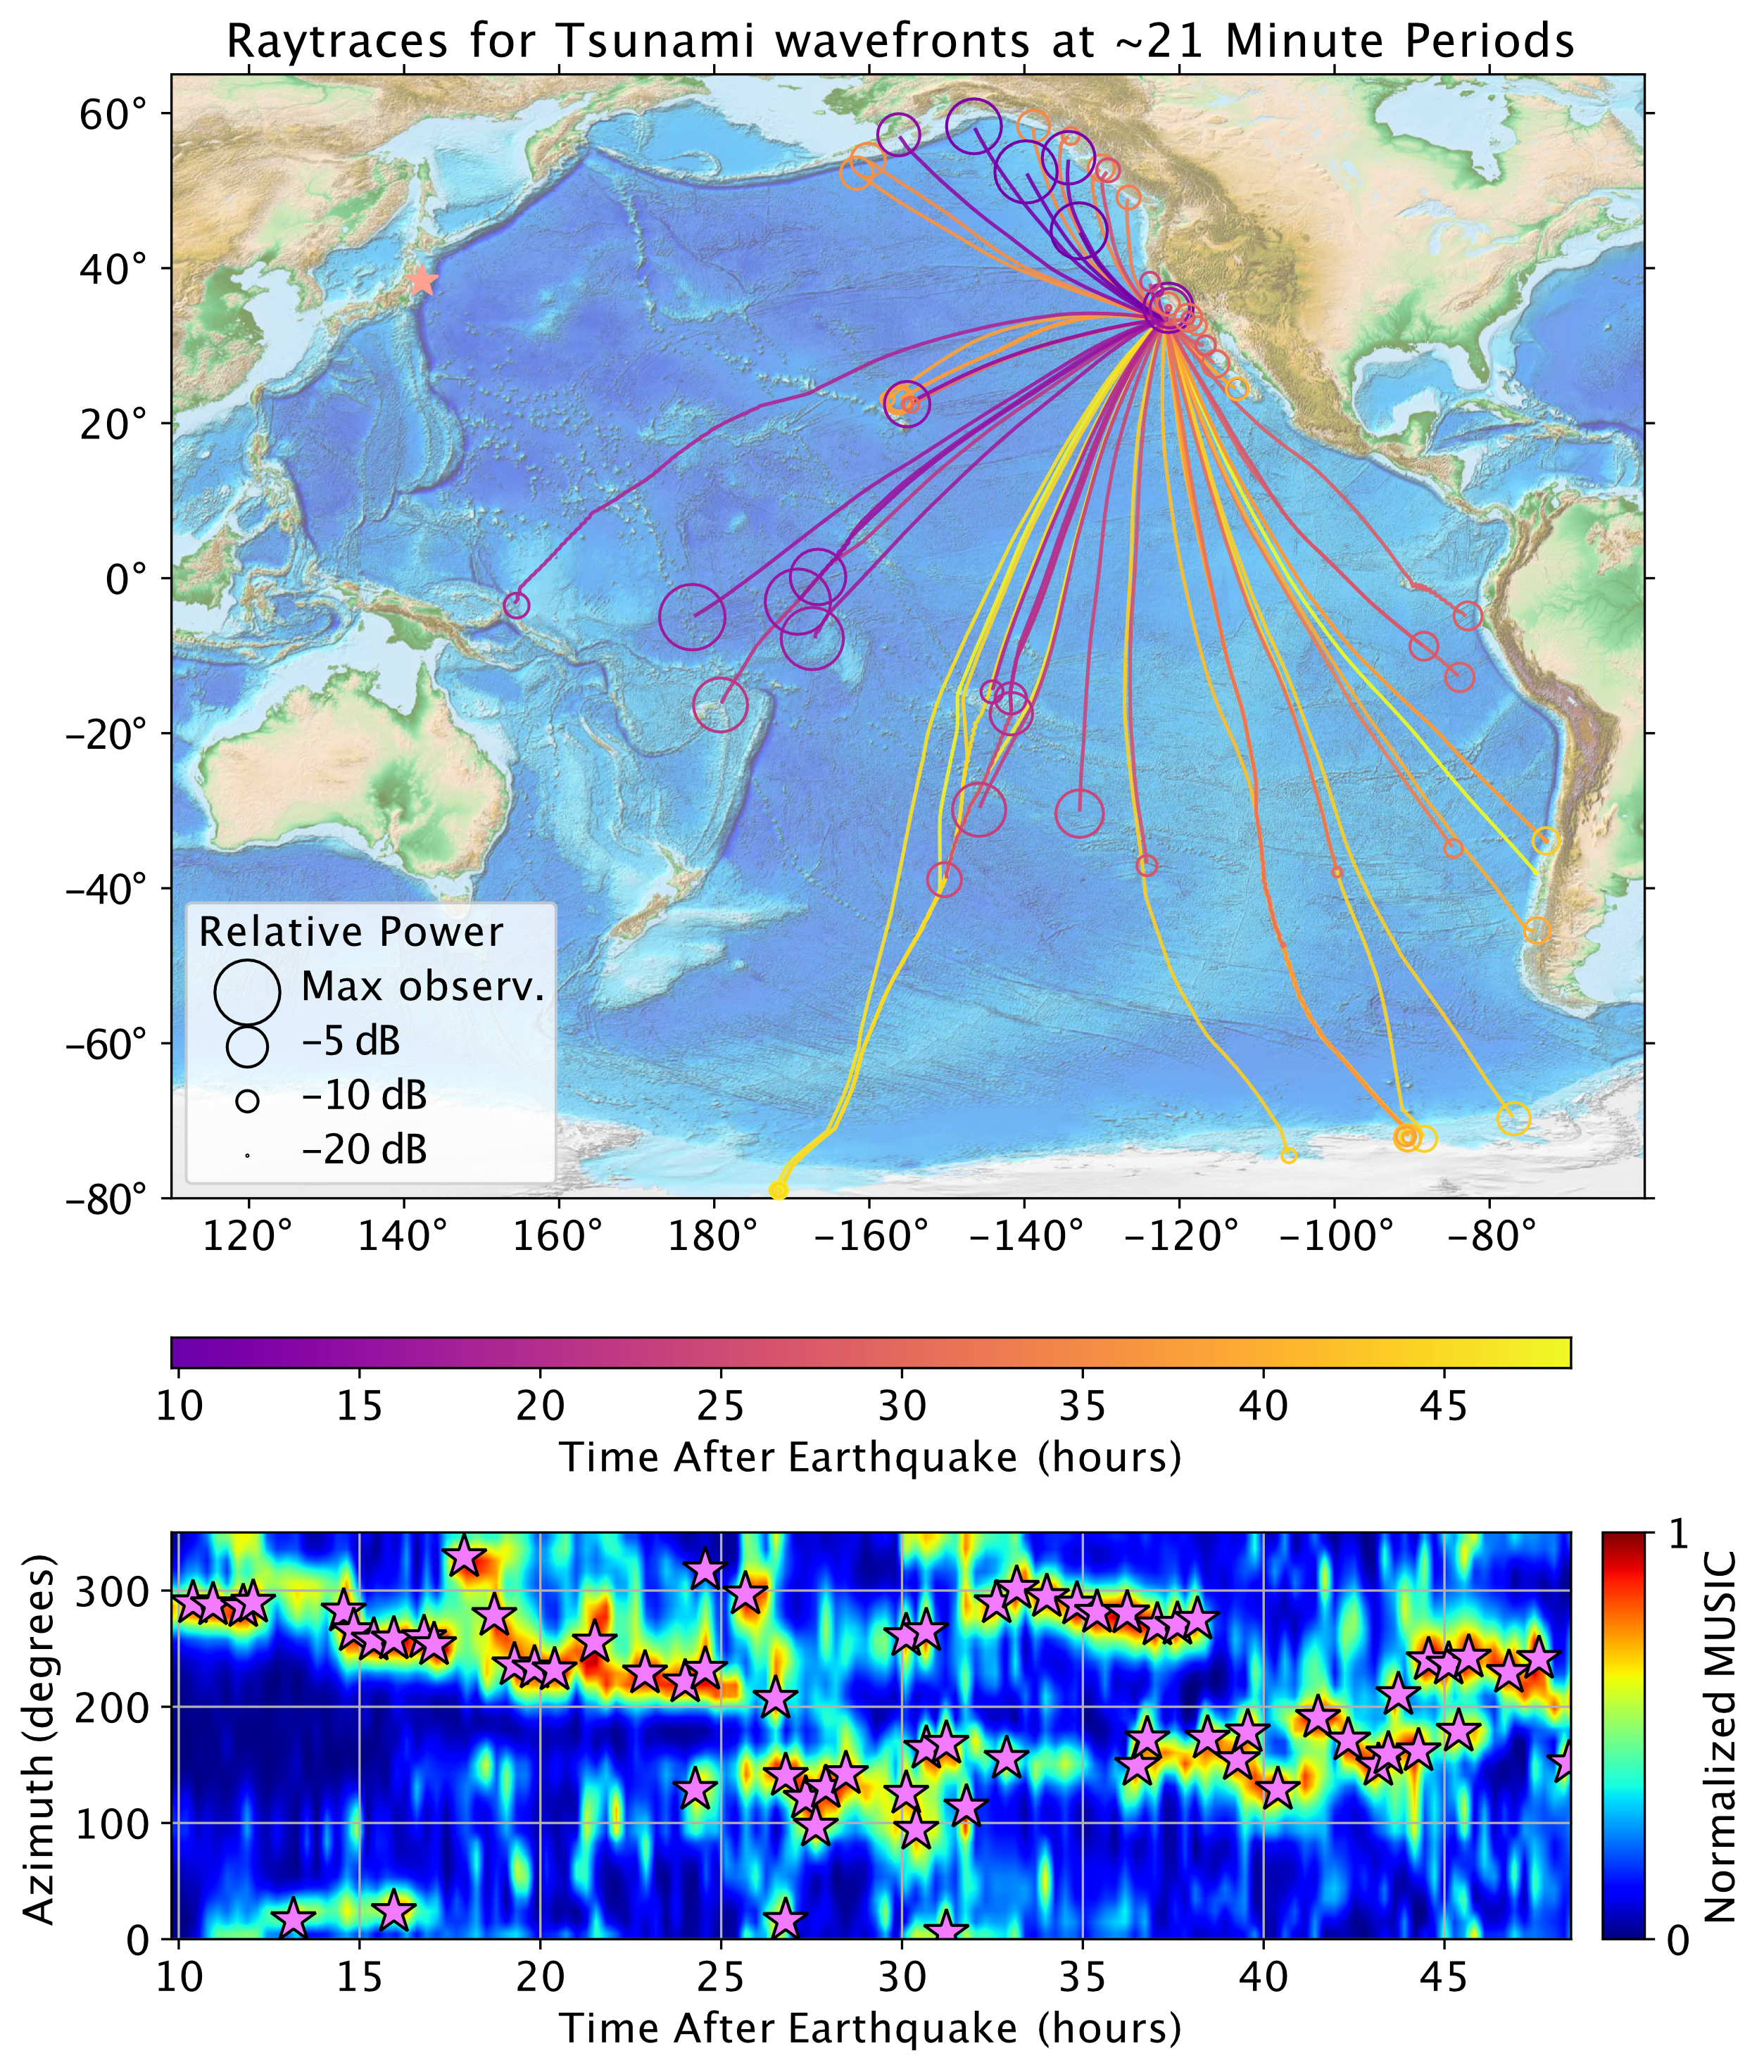
Kohler, Bowden, Ampuero and Shi (JGR, 2020) (PDF)
Ambient Noise Amplitudes
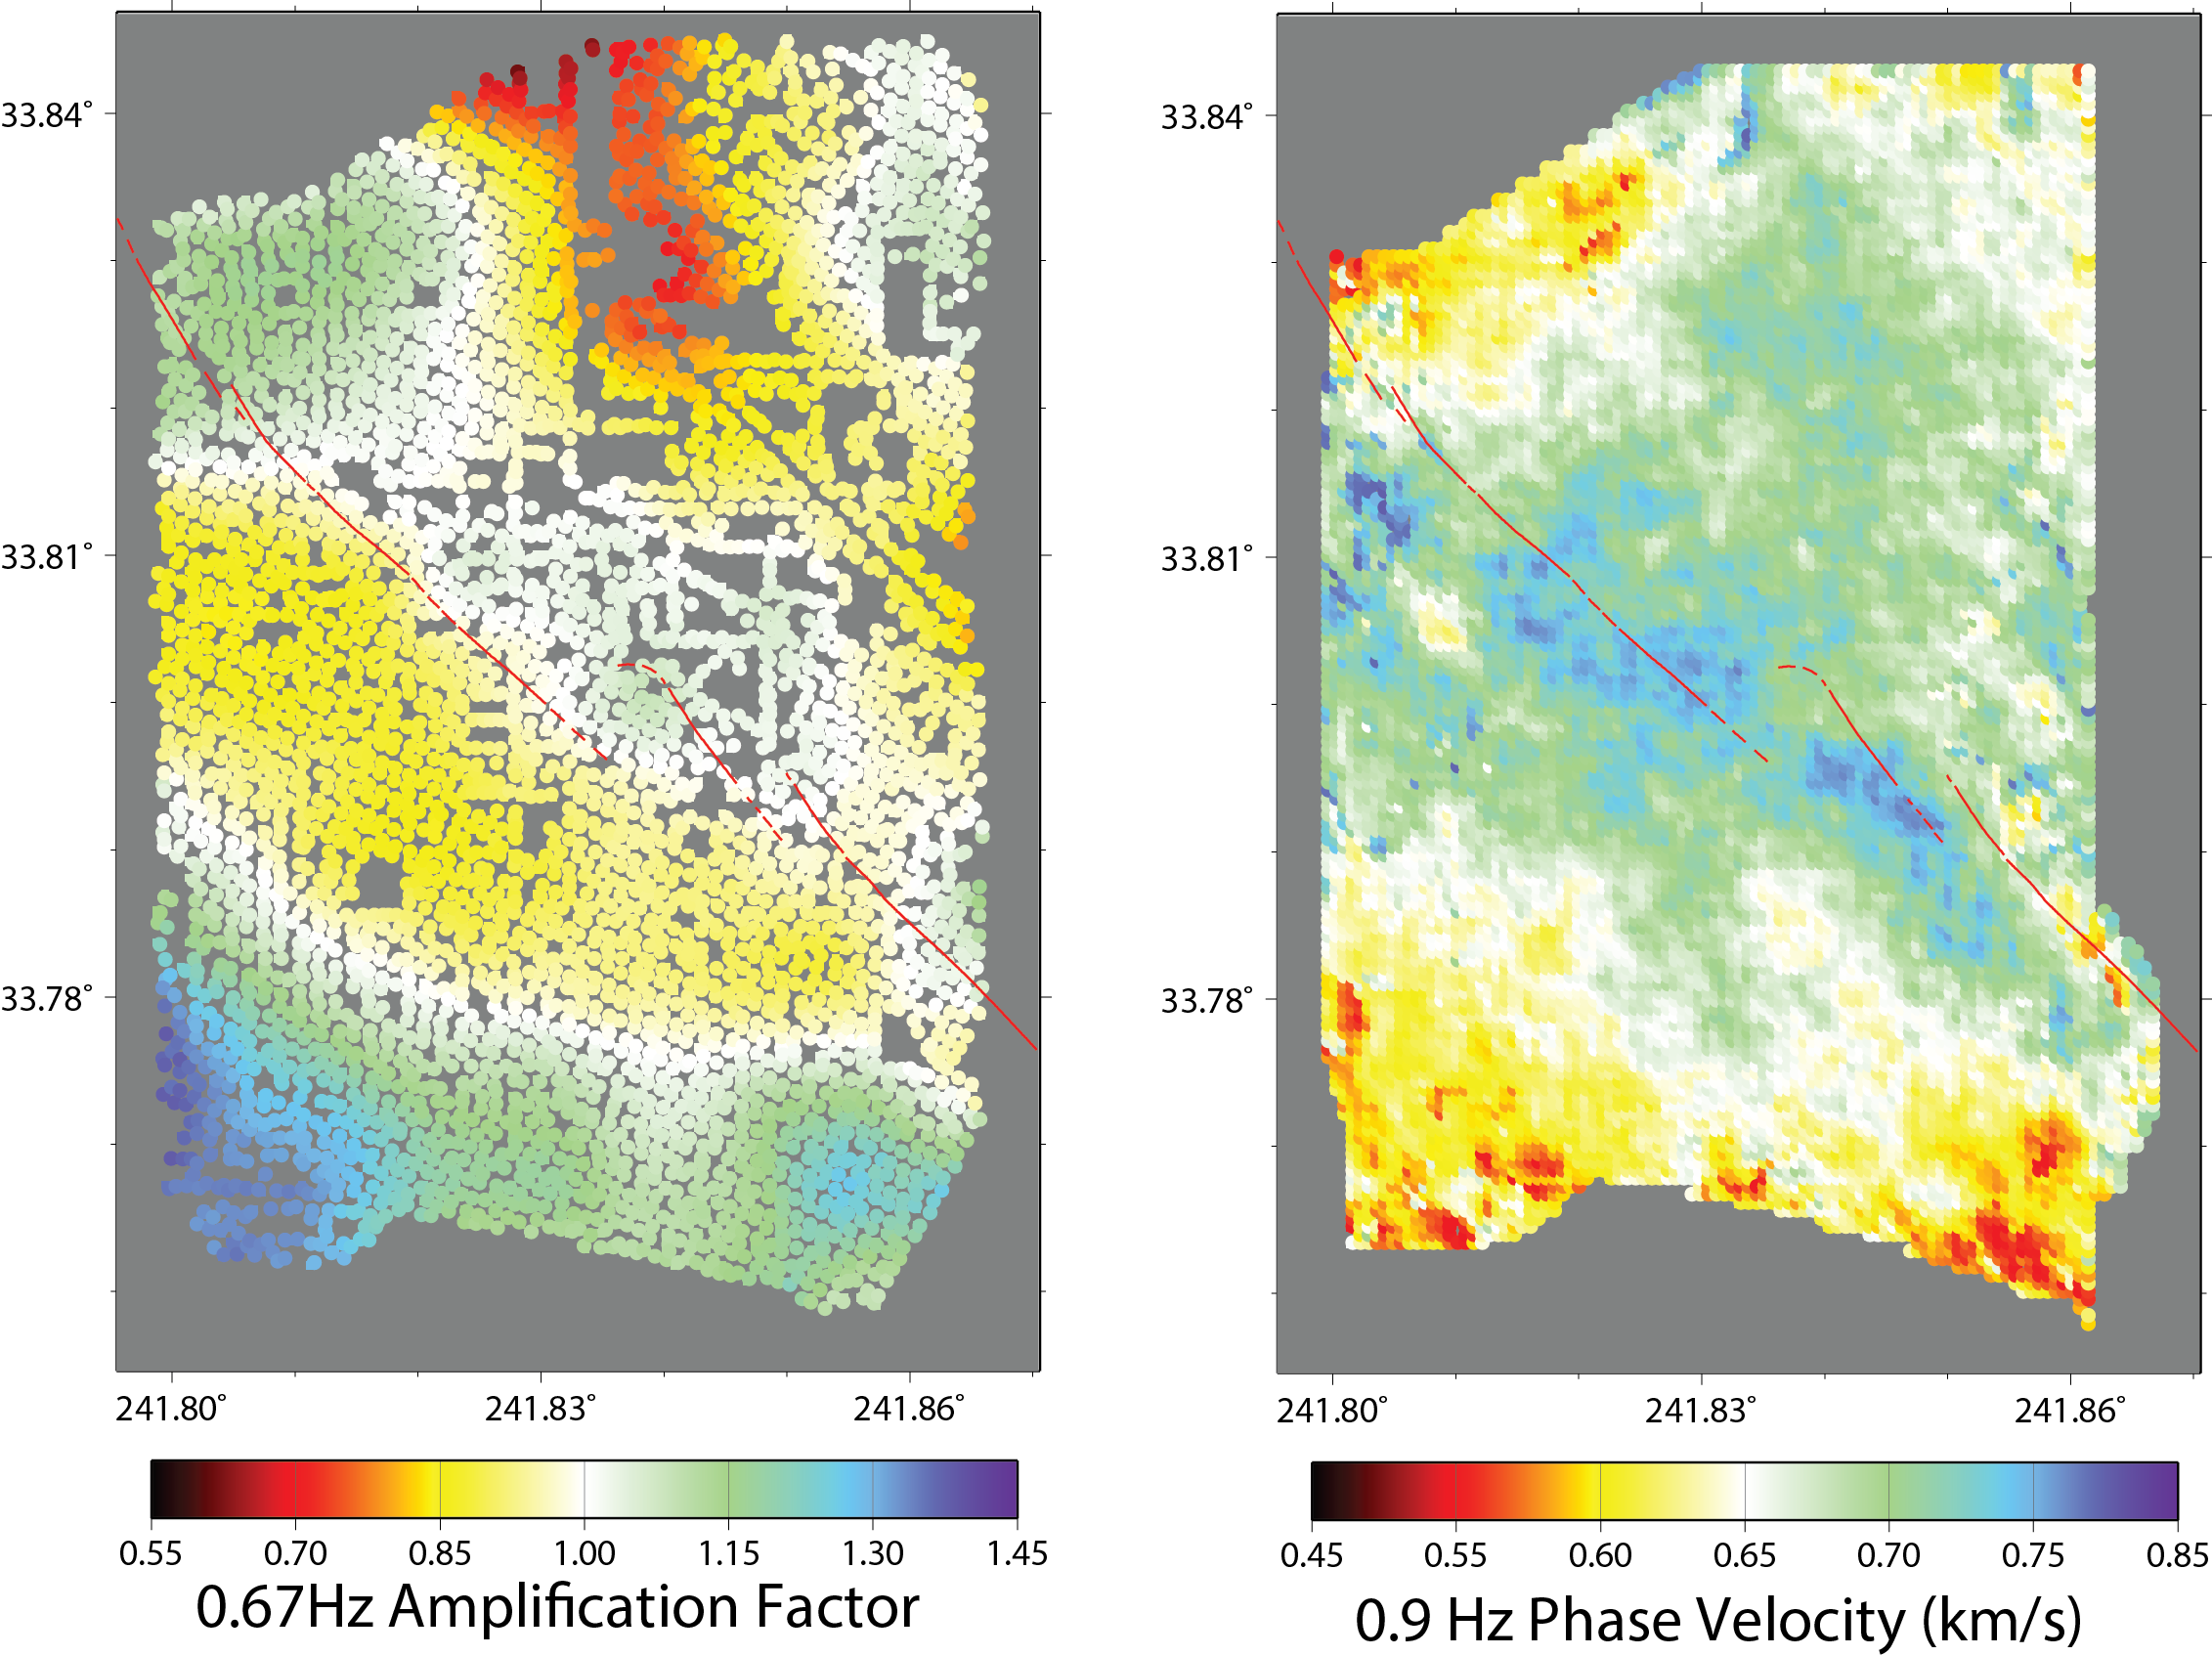
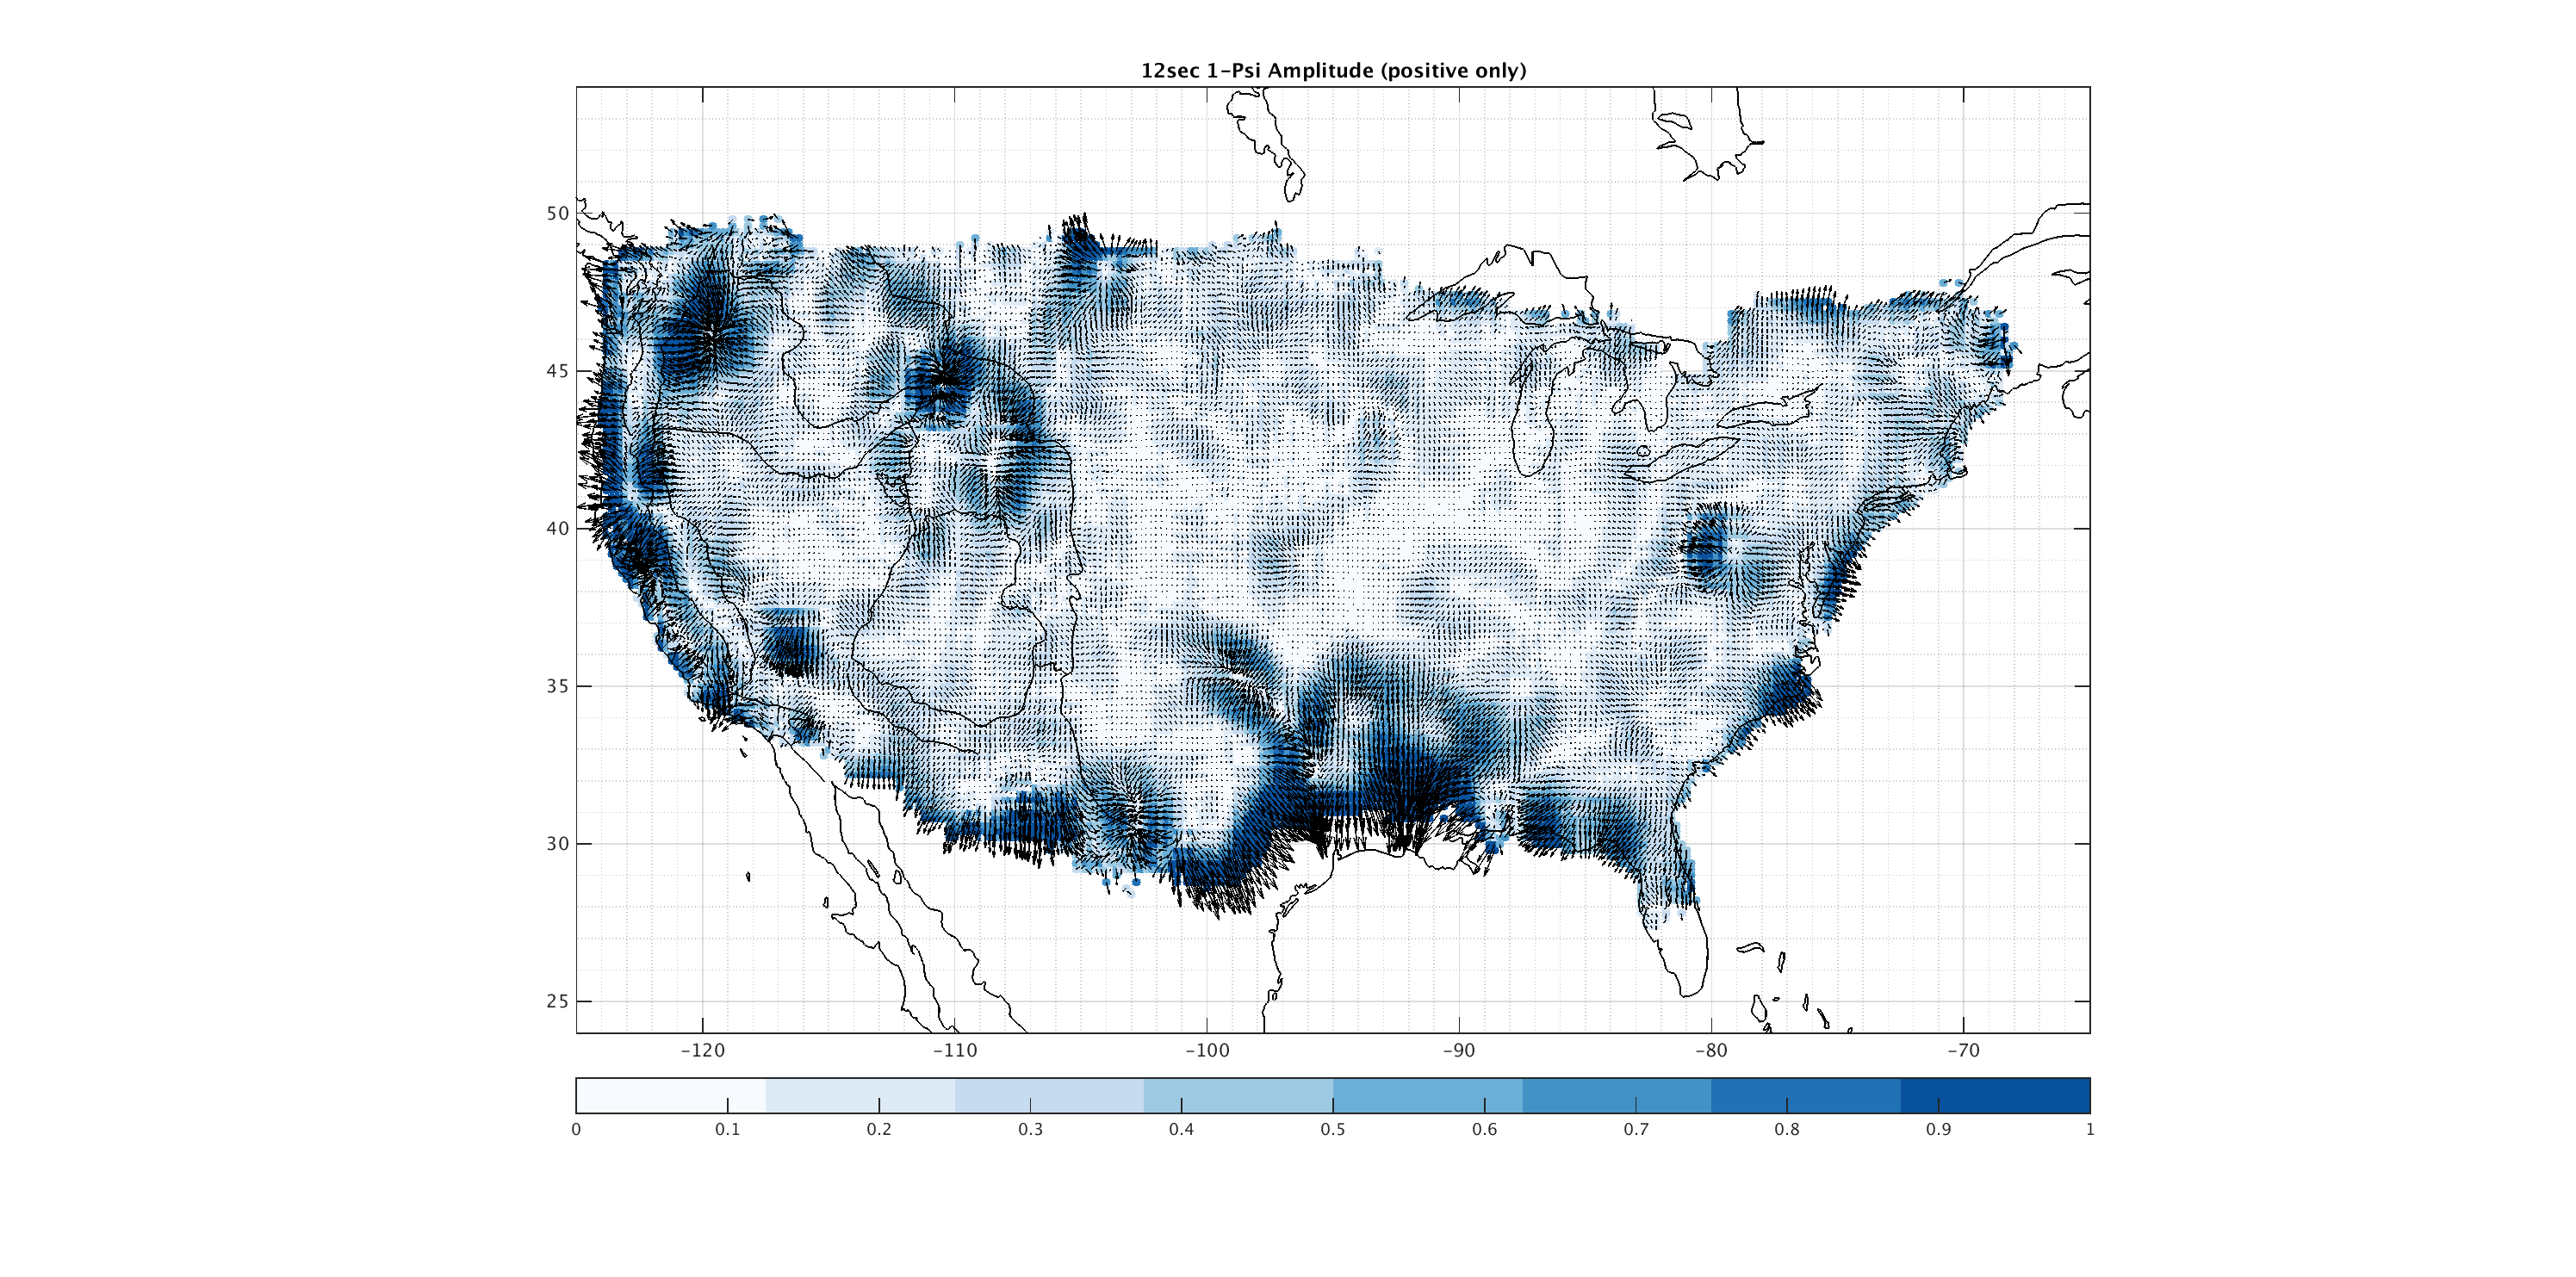
Cross correlating noise signals between pairs of seismic stations has been shown to provide fairly reliable travel time measurements. Recovering these signals usually requires significant (and clever) processing of the raw waveforms, but this usually distorts amplitude information. With the guidance of Dr. Victor Tsai and Dr. Fan-Chi Lin, we've shown that careful processing steps can allow for relative amplitude information to be measured from the noise correlation function. By collecting many such observations in a dense array, we can observe wavefronts propogating, and subsequently recover maps describing the frequency dependent spatial variability of site-response, intrinsic attenuation, and the presence of scattering or noise sources.
This has been tested on both a local scale with more than 4000 geophones from the Long Beach Array (paper) and on a continental scale with data from the UsArray (paper).
More Information: SSA Poster from 2016 (PDF)
++ More recently, work with Prof. Andreas Fichtner has advanced our understanding of how ambient noise preprocessing can be done safely. That is, how can previously developed preprocessing schemes be used to extract richer signals from the ambient noise wavefield, while also preserving linearity of the wave equation?
Fichtner, Bowden and Ermert (GJI, 2020) (PDF)
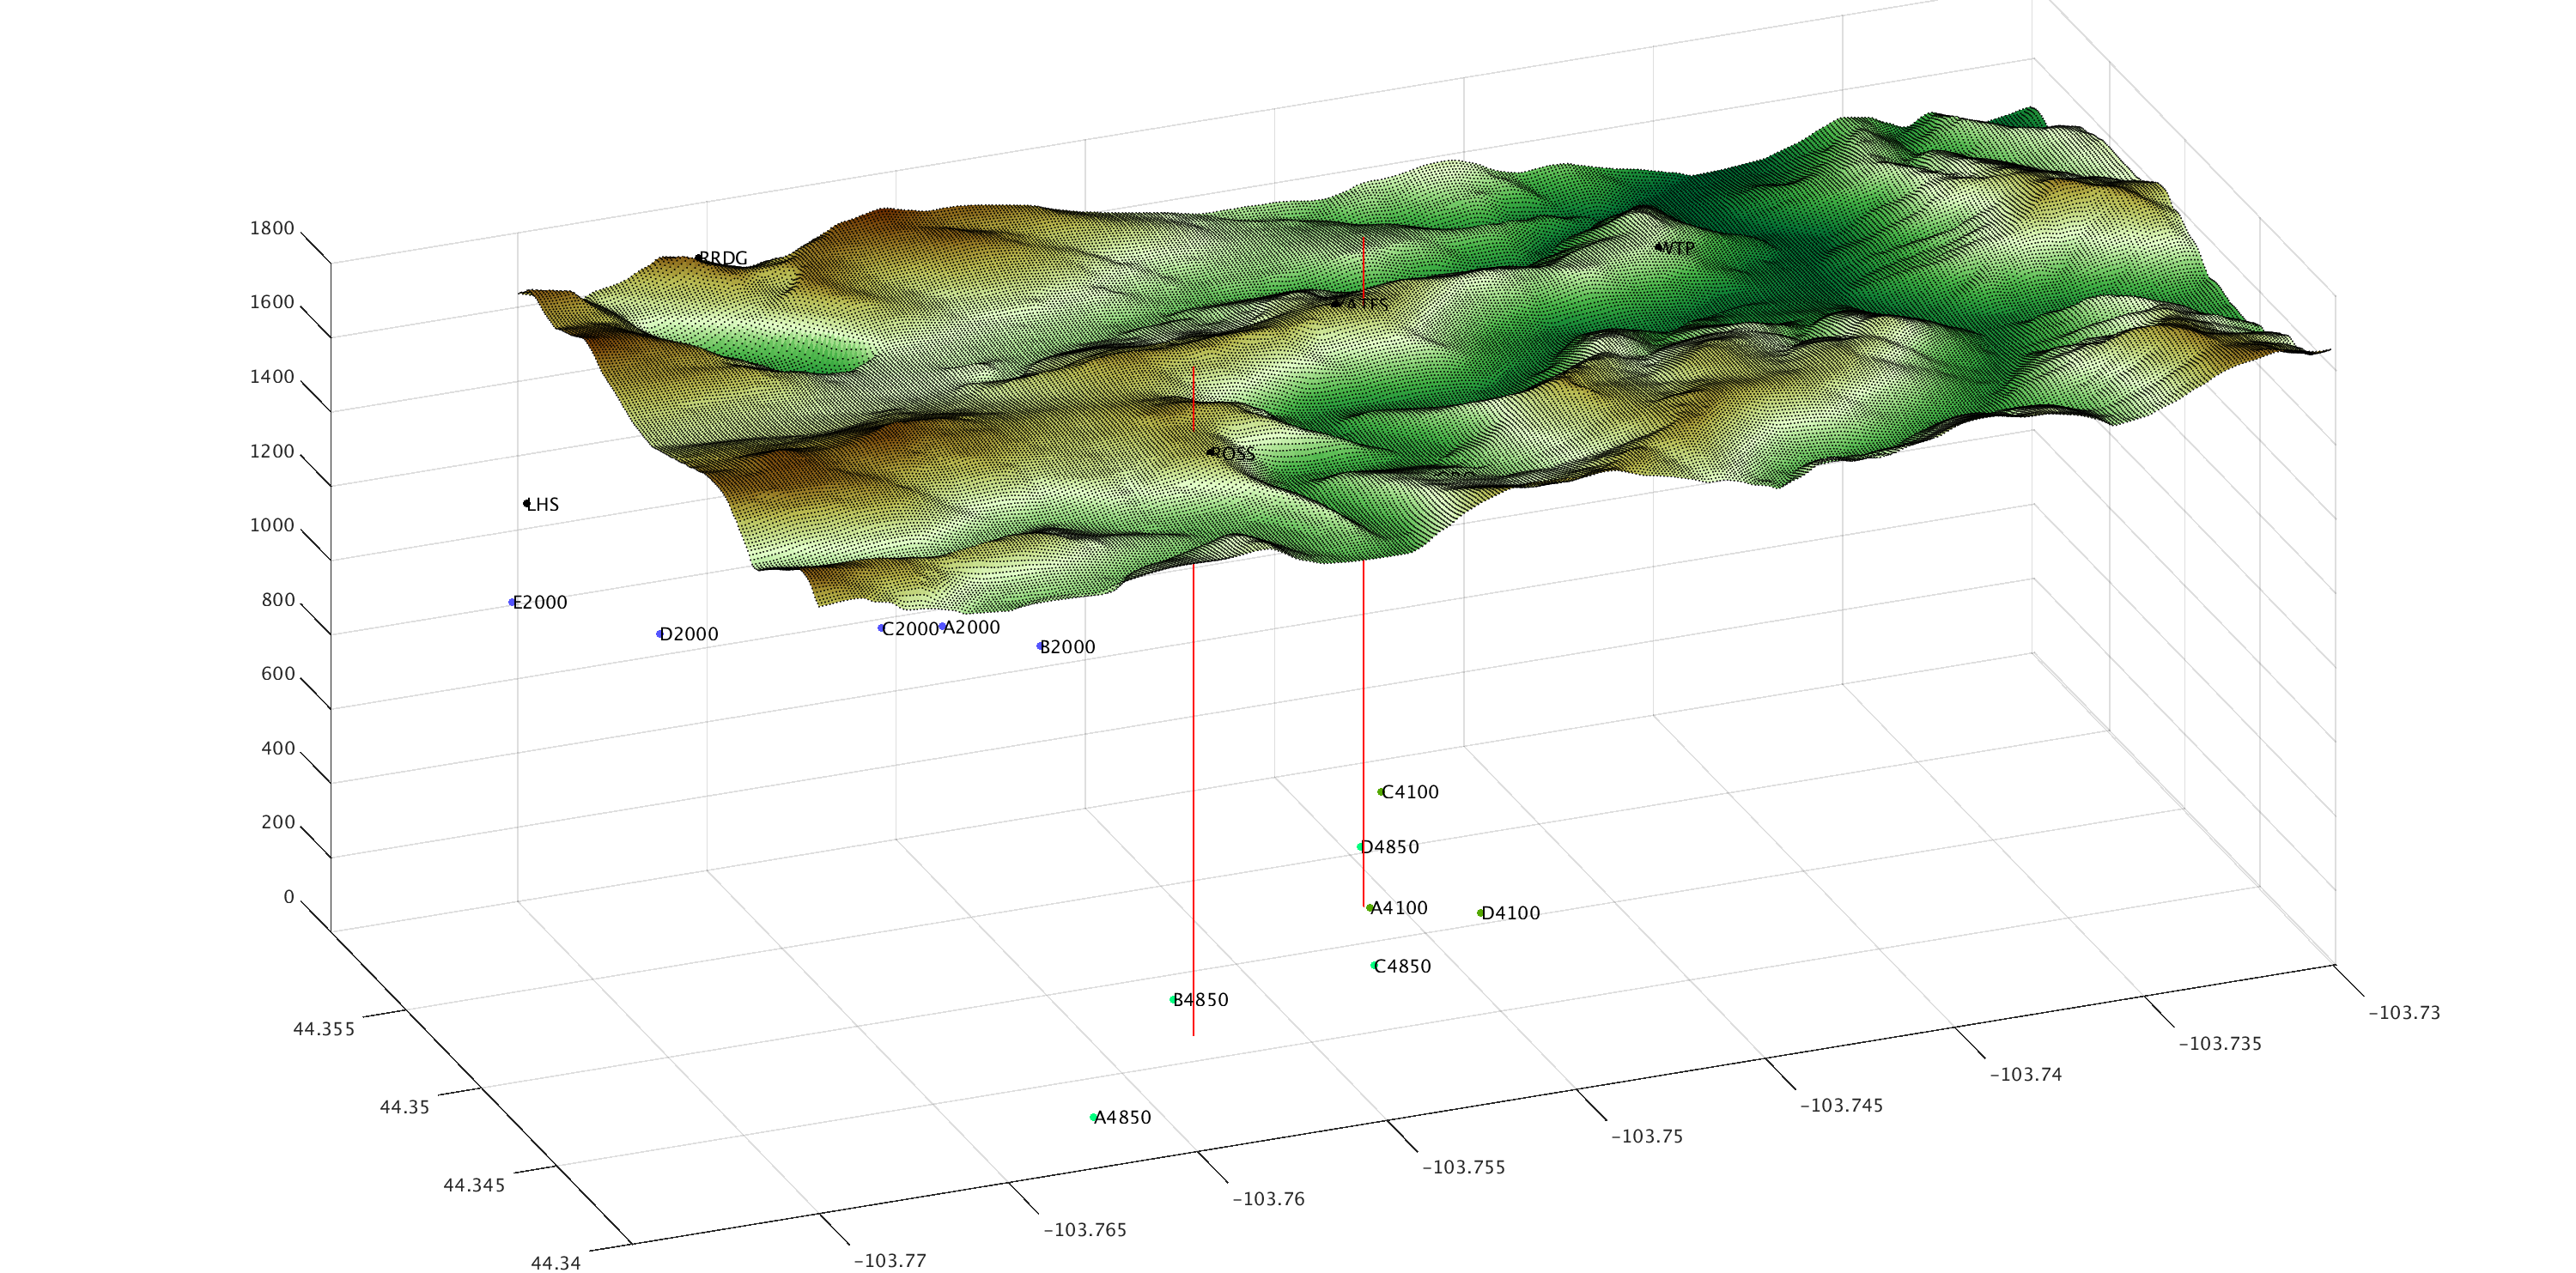
Homestake Array
We deployed a new array of 24 broadband stations at the Homestake Mine in South Dakota. The project is led by physicist Prof. Vuk Mandic, at the University of Minnesota, who studies gravity waves (i.e., signals from space, LIGO), and hopes to better characterize the Earth's signals, both ambient noise and earthquakes, which are generally problematic for gravity wave detectors. This cross-disciplinary collaboration has led to new insights about the coherence and composition of ambient noise (paper by Michael Coughlin), direct observations of surface wave eigenfunction shapes at depth (paper by Pat Meyers), and a Bayesian, 3-component, 3-dimensional beamformer - referred to as the Radiometer in physics terms (paper coming soon from Pat Meyers).
Array overview by Vuk Mandic, et al (SRL, 2018)
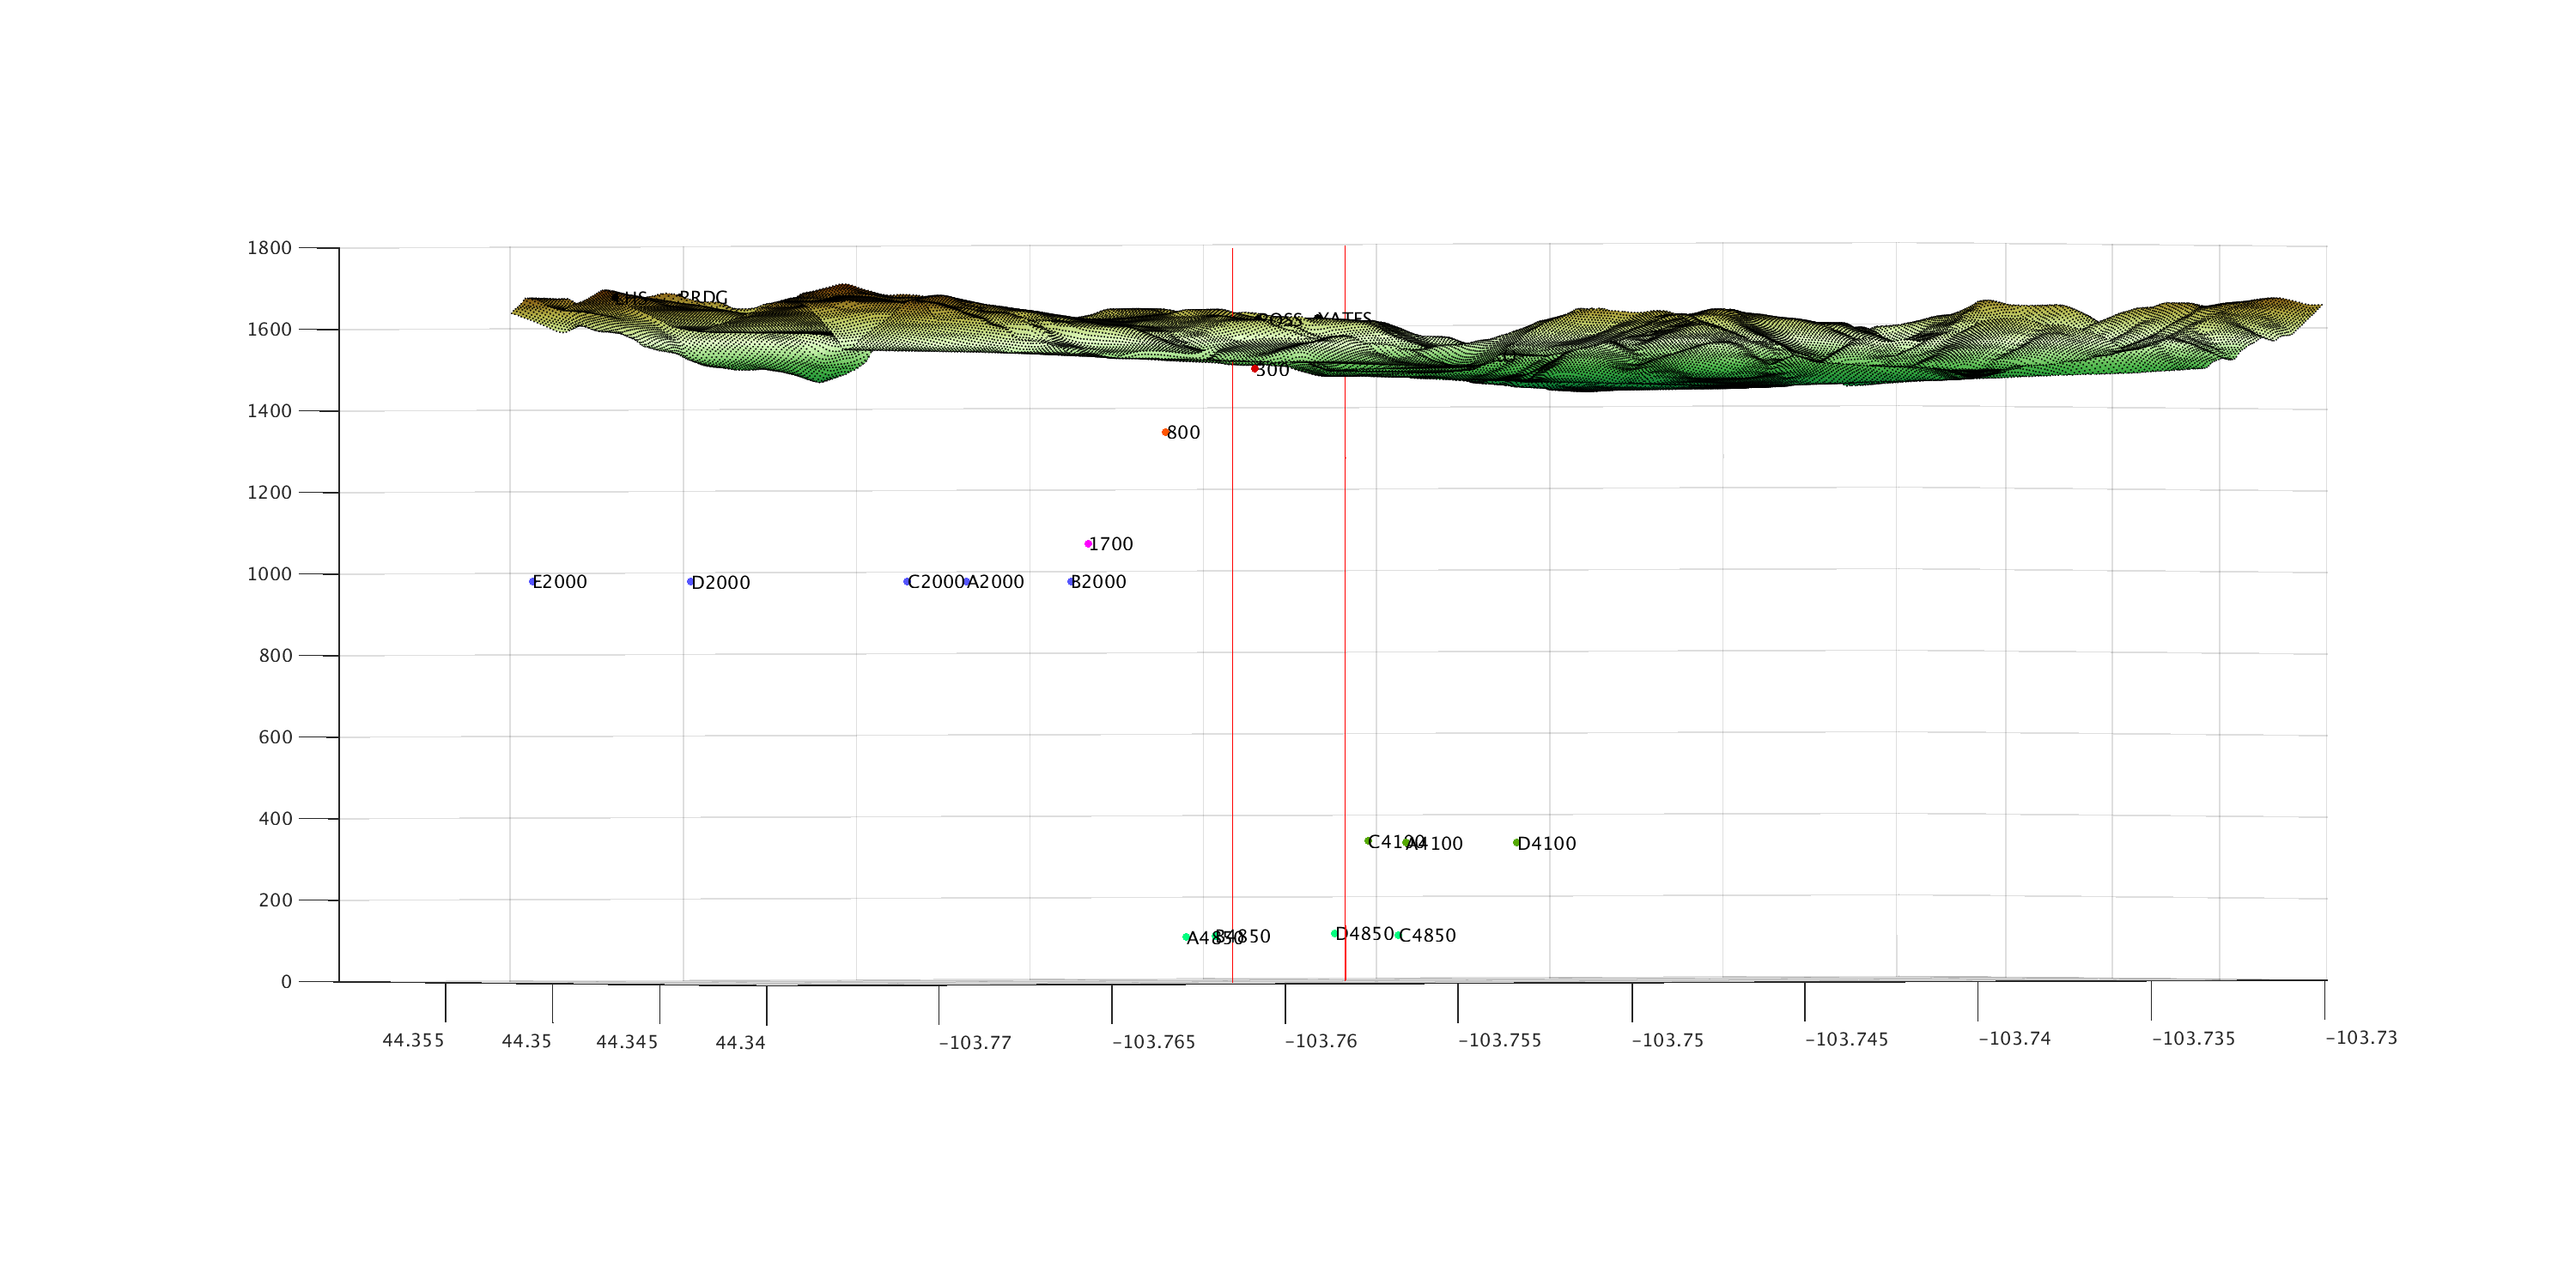
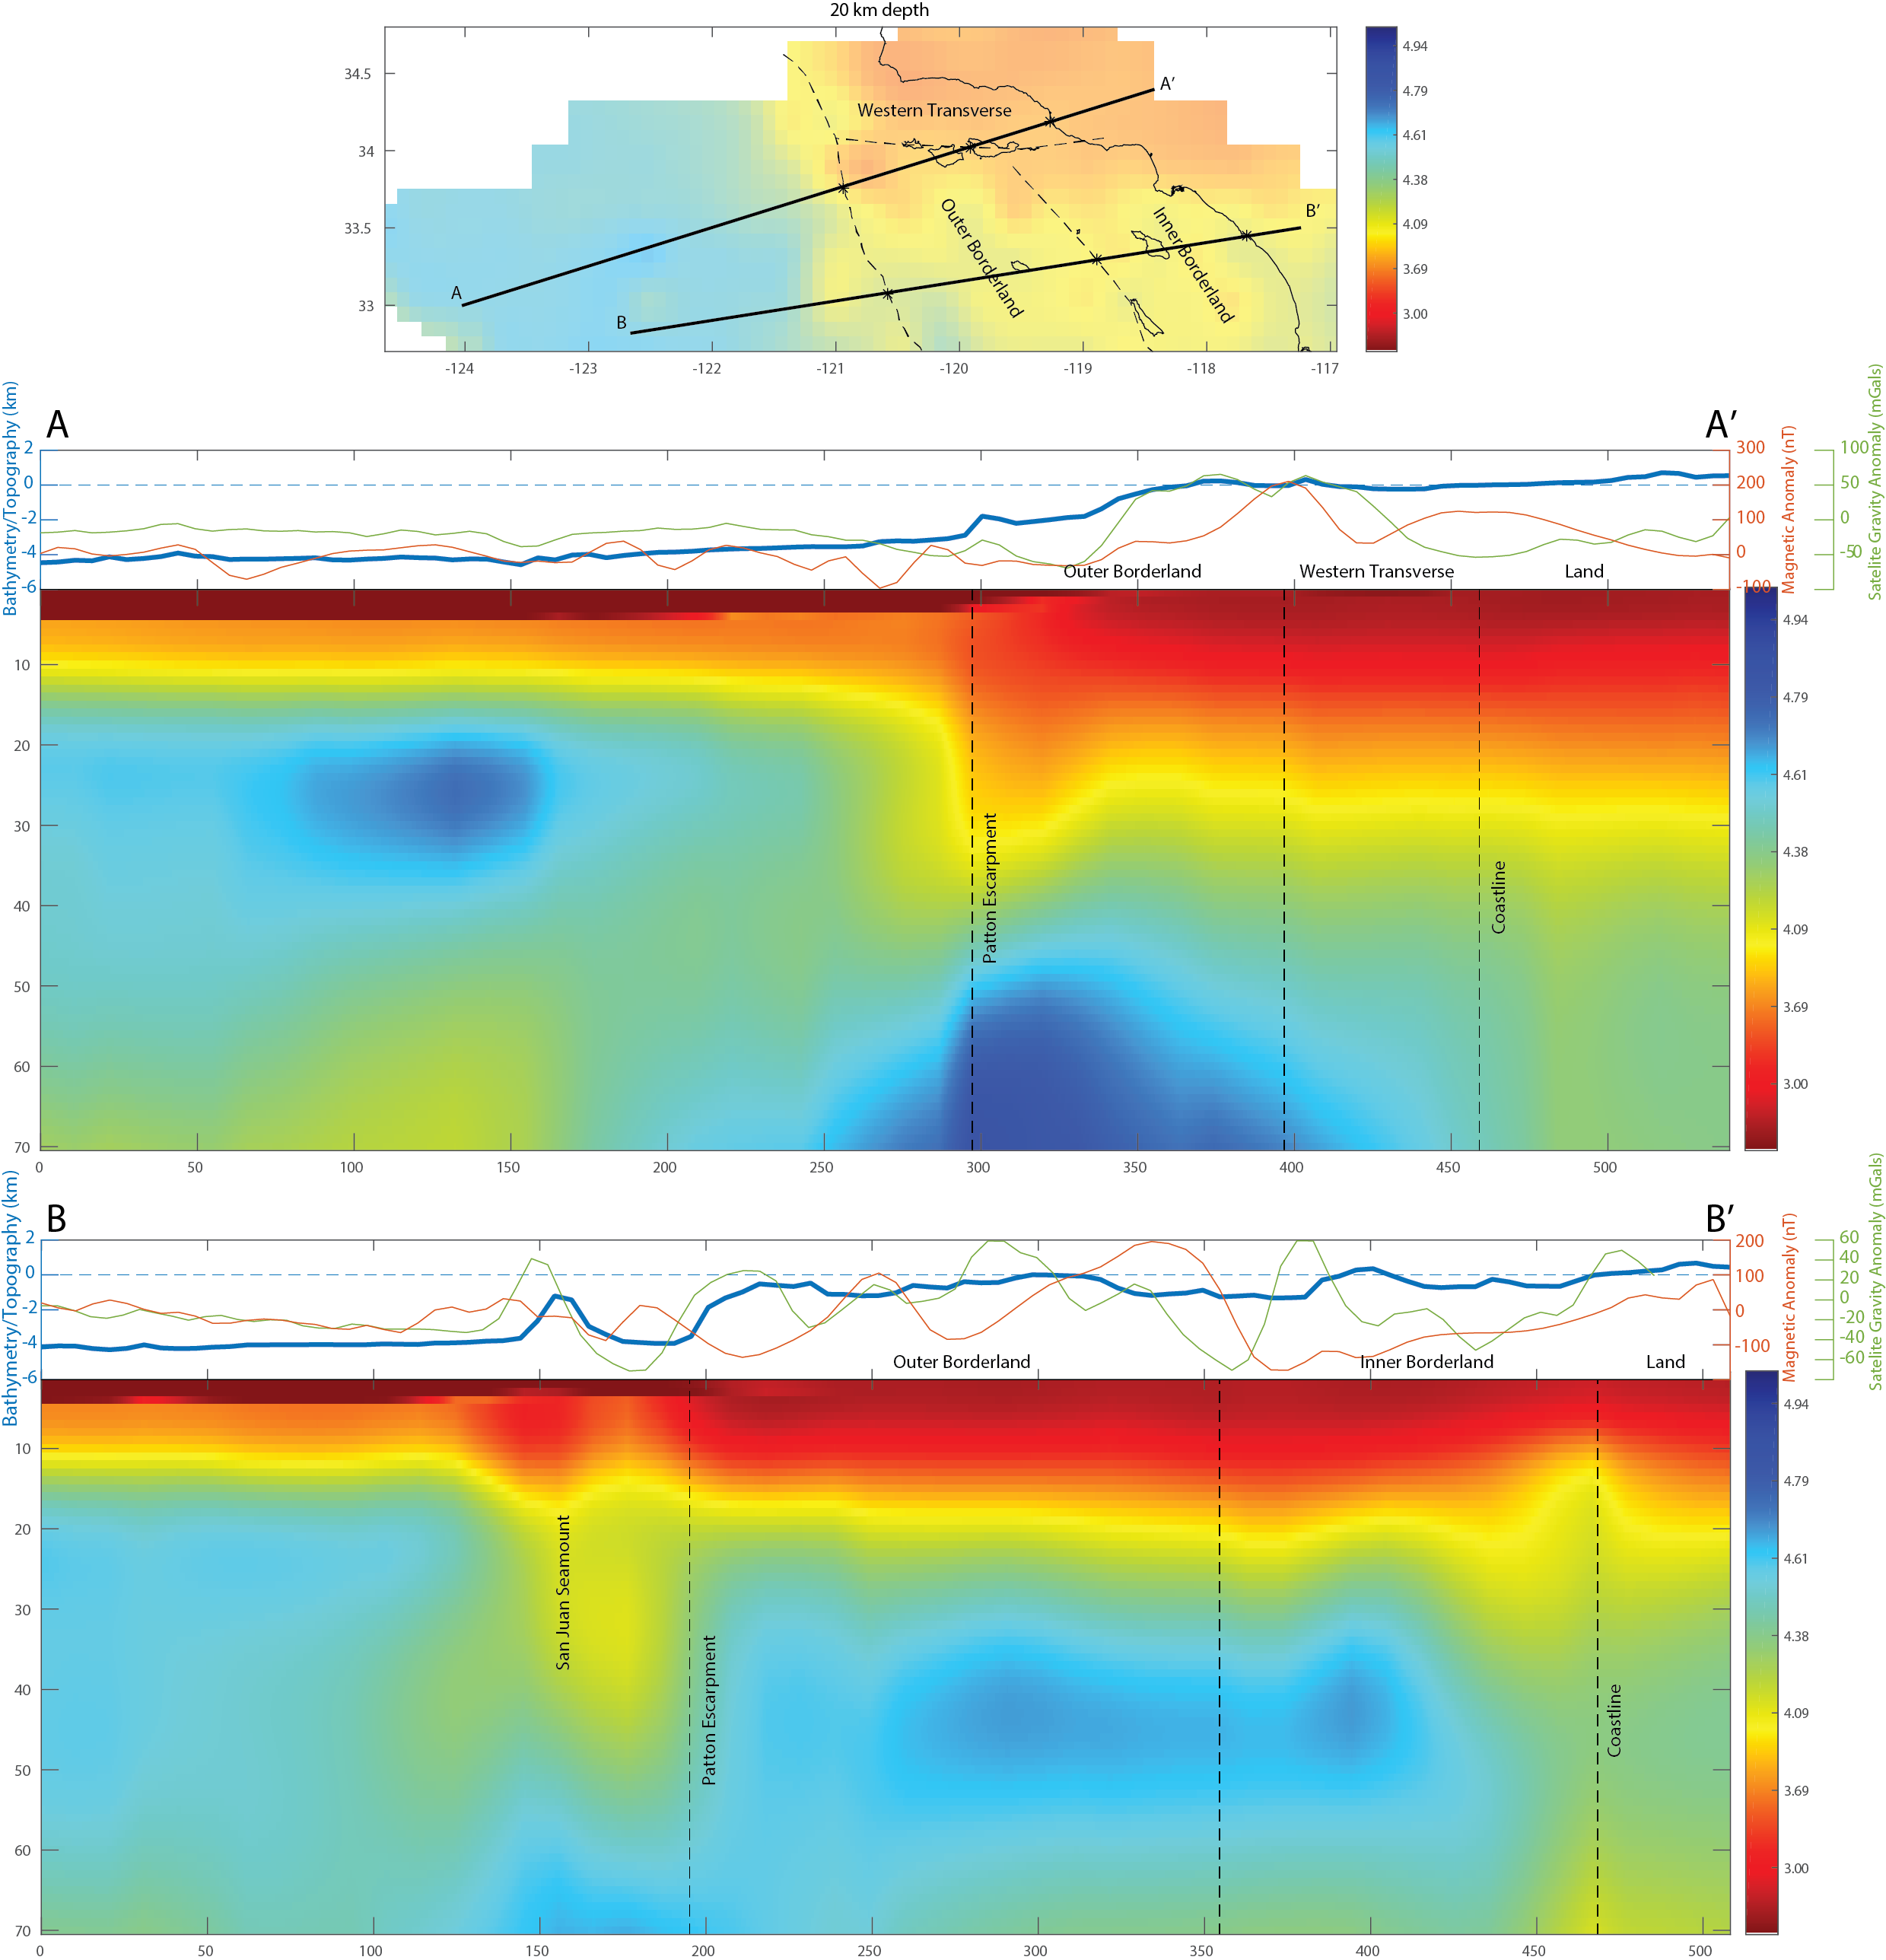
Velocity Model offshore Southern California - ALBACORE
An array of Ocean Bottom Seismometers (OBS's) were deployed offshore southern California for one year in 2011 and 2012. Through ambient noise tomography we have created a 3D velocity model of the region to better define the transition between Ocean and Continental crust, as the borderland region and Patton Escarpment have a long tectonic history. Due to the unique environment of the OBS's, special attention was paid to first removing the effects of instrument tilt and infragravity waves using the on board pressure sensors, as well as other noise pre-processing techniques.
AGU Poster from 2015 (PDF)
Paper (PDF)

Before starting Grad School, I got to learn about earthquakes firsthand from the experts, by working for more than a year at the USGS National Earthquake Center in Colorado. My two main projects there were:
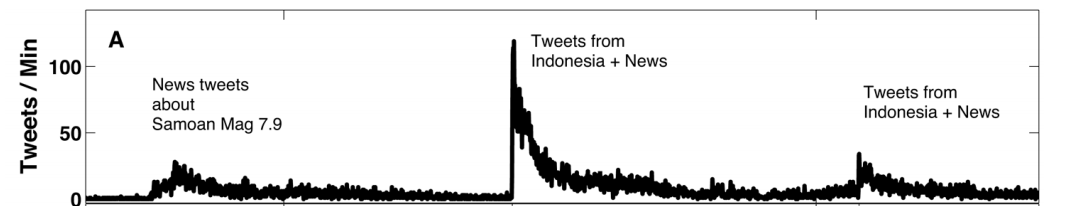
Twitter Earthquake Detection
After experiencing a natural disaster, people often reach out on social media to share their experience (assuming they are in no other immediate danger). I joined a team at the USGS led by Paul Earle to monitor public tweets with keywords relating to quakes (and other languages: temblor, terremoto, gempa, etc.). We designed a system which could positively identify earthquakes around the world on a daily basis, and provides analysts at the USGS an additional tool to understand the societal impact of a given event.
Aftershock Deployments
At the USGS in Golden, CO, I worked with Mark Meremonte to maintain and deploy a set of ~40 instruments used for aftershock studies, and other special interest topics. Mark's lab specialized in providing some of the highest quality seismic instrumentation that could be provided in a quick and portable array.
