MAPS - Mobile Aerial Positioning System
Scalable Ultra-wideband localisation
with application to autonomous video production
 Tiago Salzmann
 Yvan Bosshard
The Idea 
MAPS, short for Mobile Aerial Positioning System, is an indoor and outdoor localisation platform which provides fast and reliable localisation needed for autonomous video production using a GPS-like approach. It consists on TDoA (Time Difference of Arrival) measurements from UWB (Ultra-Wide-Band) signals and features fast and convenient setup, low-power devices and fast localisation rate.
The most important advantages of a TDoA scheme and its challenges are summarised below:
Passive tags TDoA measurements can be achieved without a tag having to actively send any messages. Like a GPS receiver, it only listens to data being broadcasted by the anchors (satellites). This not only decreases power consumption, allowing the system to be incorporated into low-power applications, but also eliminates the need for coordination between the tags.
Arbitrary number of tags Without the need for coordination between the tags, a running system can be extended by any number of tags, most importantly without reducing the positioning rate.
Low power As the tag is passive, power intensive sending of messages can be avoided.
Small devices With a new generation of UWB devices, the whole system can be run with comparatively small devices, that can be integrated into existing hardware, using a serial connection.
Clock synchronisation While GPS satellites carry atomic clocks, the small devices used need another way to reliably time their actions. Badly synchronised clocks inherently affect the precision of the localisation.
Fast localisation Albeit not being affected by multiple tags, the rate of localisation still is limited by numerous factors, e.g. propagation time of the signals, time to process a message or to calculate location.
Ease of use To allow the system to be easy to use, easy to maintain, fast to set up and convenient to adapt, a good amount of time needs to be dedicated to a carefully structured architecture.
TDoA - Time Difference of Arrival
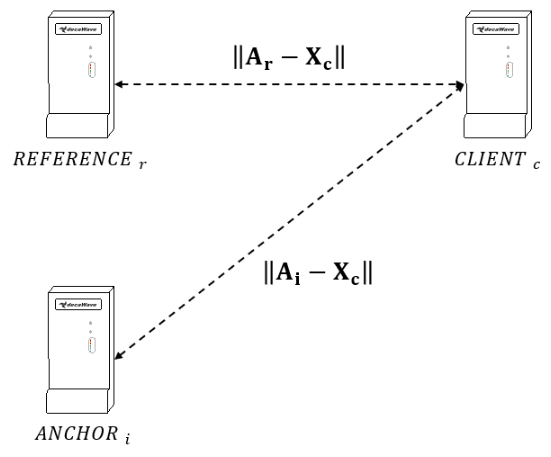
At a given point in time $t_{BR}$, known to all devices on the network, every anchor sends out a message containing its identifier. Due to the difference in distance $d_{i,c} - d_{j,c}$ between a client and anchors $i$ and $j$ respectively, the messages will (most of the time) not arrive at the same time. If the timestamp of arrival of a message from anchor $i$ at the client is denoted with $t_{BR,i}^{(c)}$, then the time of flight (and thus the distance) could easily be calculated using $\hat{t}_{i,c} = t_{BR,i}^{(c)} - t_{BR}$
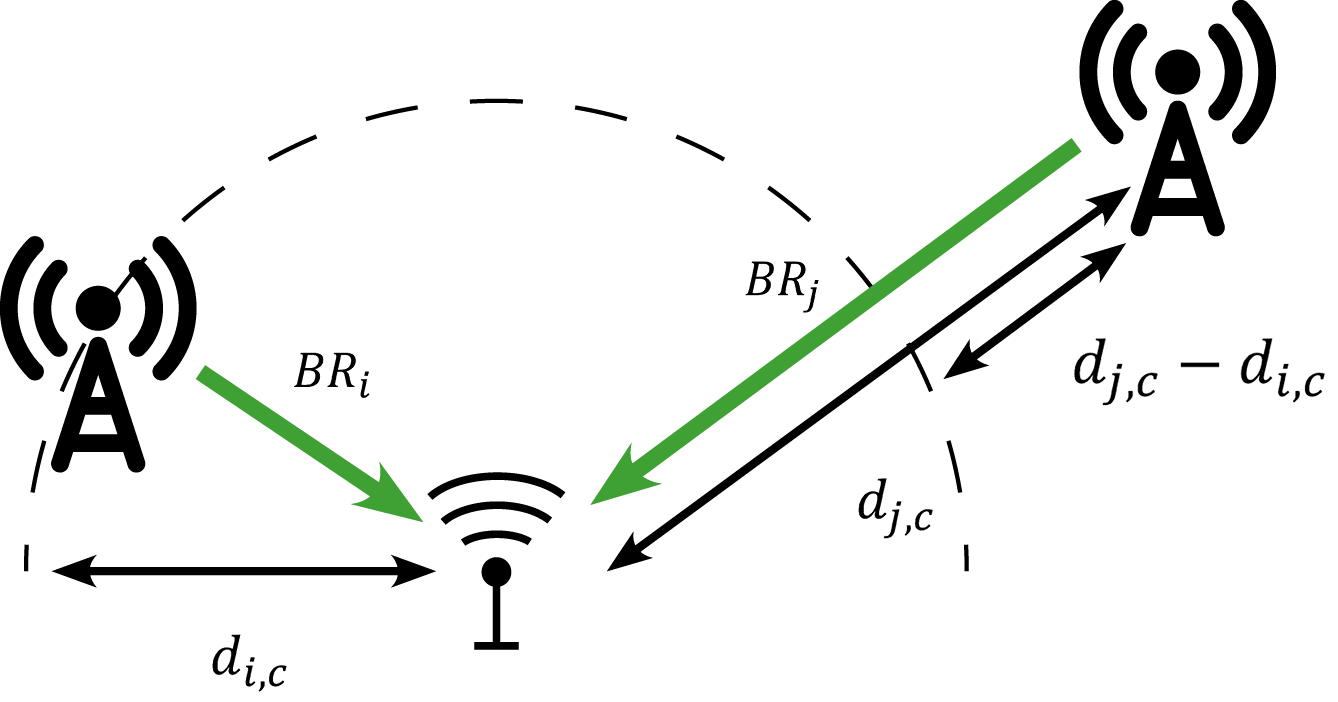
However, the clocks of clients are not synchronised for clock offset, which prevents the use of this equation, since the value $t_{BR}$ has no meaning in the frame of reference of an unsynchronised clock.
On the other hand, the difference in propagation time between the messages of two anchors can be calculated as
$$\mathbf{\tau_{i,j}} = \hat{t}_{i,c} - \hat{t}_{j,c} = (t_{BR,i}^{(c)} - t_{BR}) - (t_{BR,j}^{(c)} - t_{BR}) = \mathbf{t_{BR,i}^{(c)} - t_{BR,j}^{(c)}}$$As it turns out, the difference in propagation time is equal to the difference in arrival time (the TDoA value). This might seem intuitive, but the fact that this calculation does not rely on the sending time point is crucial as it allows the client to work without offset correction. The only requirements are the synchronisation of the anchors and the clock drift correction on the client.
The Solver - Estimating the Position
Hardware
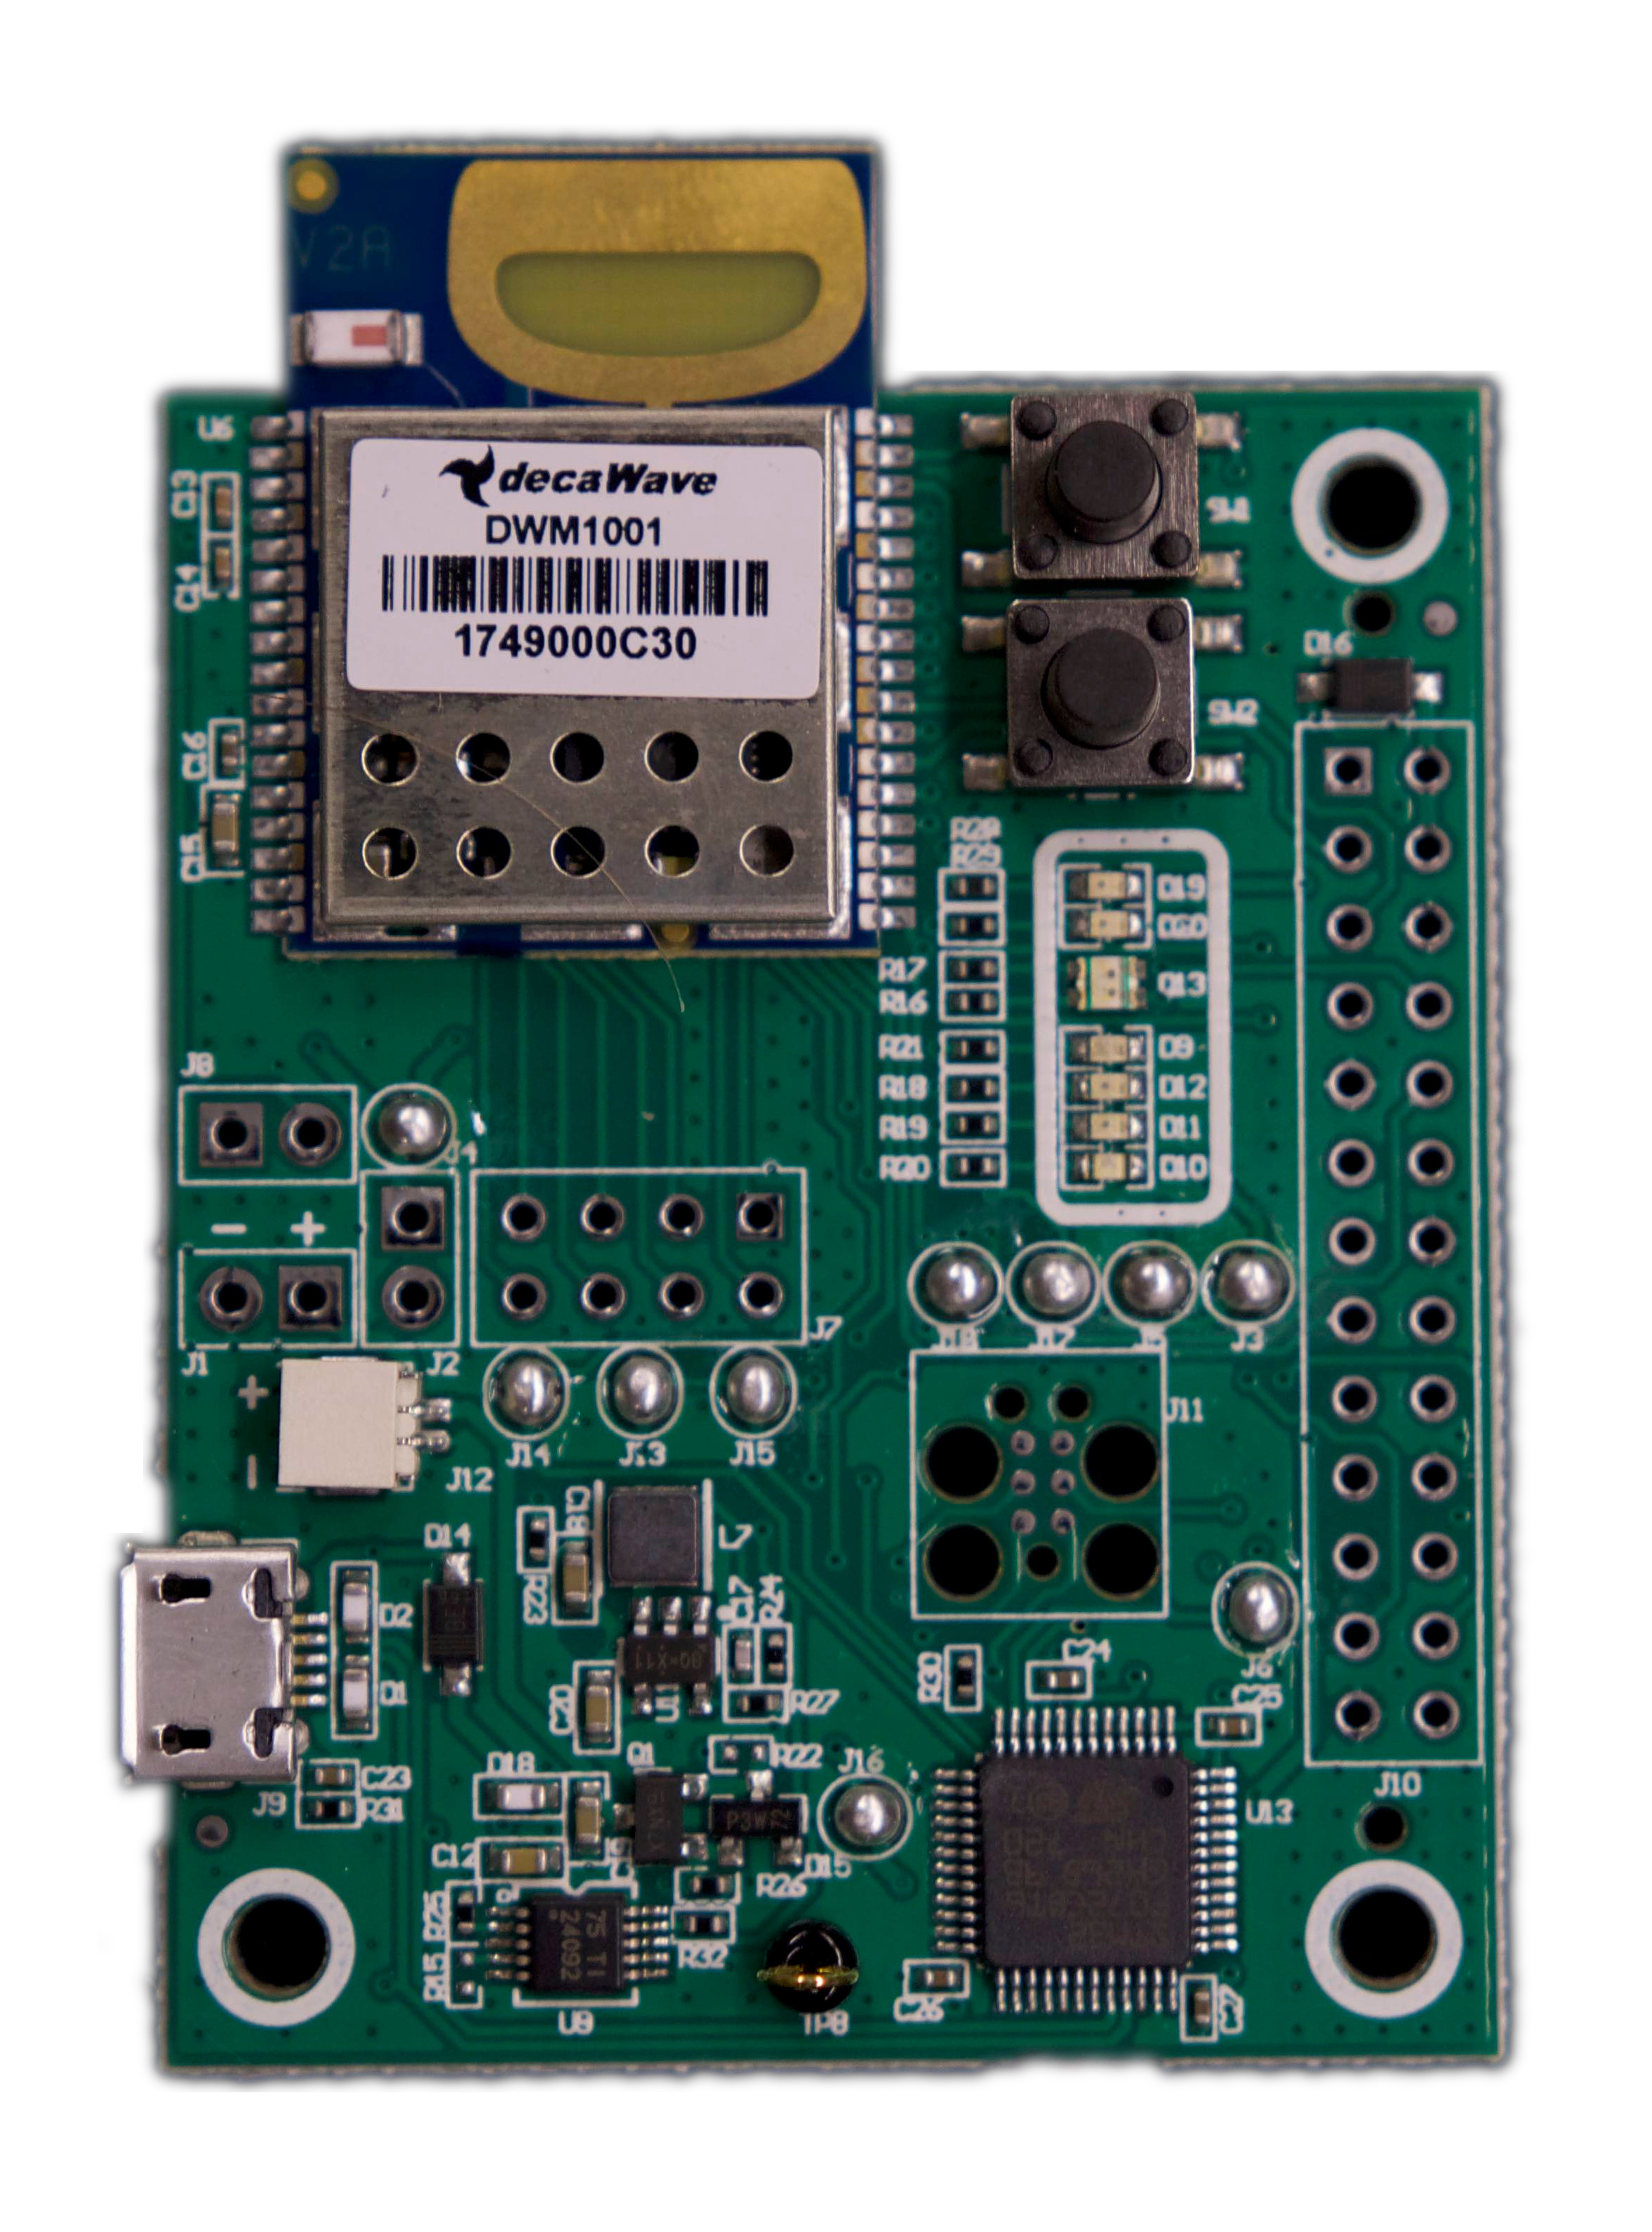
One interesting aspect of the system is that the device nodes (master, client and anchor points) all share a common piece of hardware. They are all based on the same DecaWave Development Board DWM1001-DEV and differ only in the firmware. The device is equipped with an UWB module (DW1000) and the nRF52 chip as the host micro-controller.
The main features of this hardware combination are listed below:
- Bluetooth capability
- J-Link probe for debugging purposes
- 8 Mbps SPI communication with the UWB DW1000 module
- Crystal-trimming for fine clock speed adjustments
- A double-buffer to cope with the high rate of incoming UWB packets
The board is also equipped with many other features like multiple status LEDs, user buttons, serial ports for communication etc.
System Interface
The overall system is very complex, with many different parameters mediating refresh rates, sync periods, anchor data and positions and much more. One major concern is the amount of tunable parameters that control this system, as one of these parameters may affect other features.
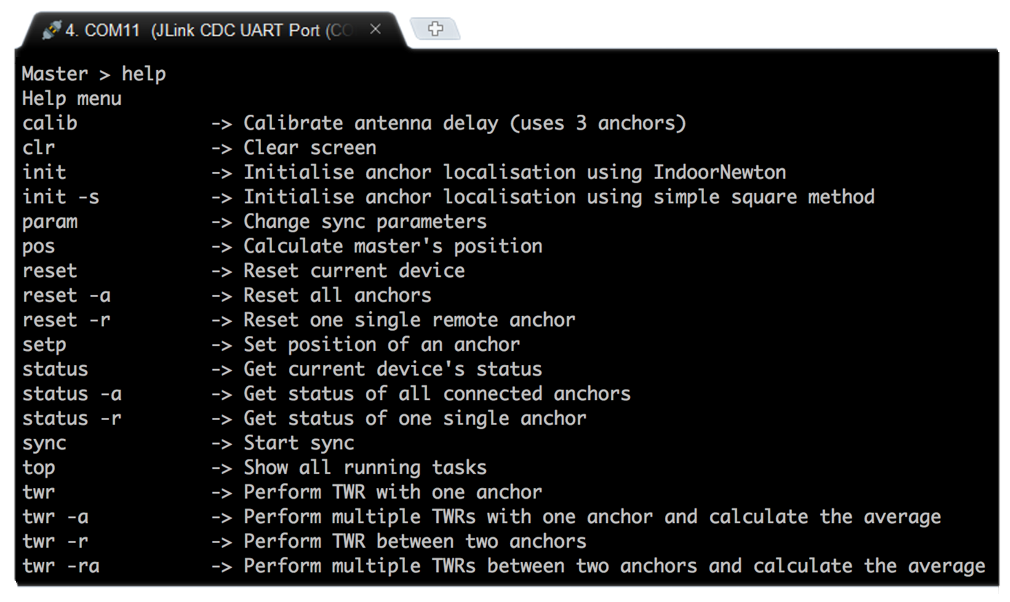
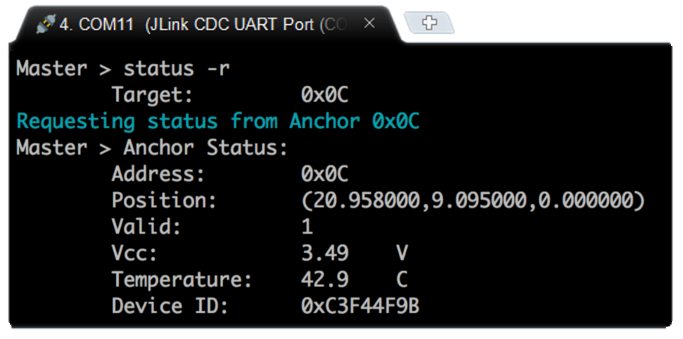
A command-line based interface enables the user to easily change any parameter of the system during execution, without the need of recompiling the whole program.
Raw Data & Position Plotter GUIs
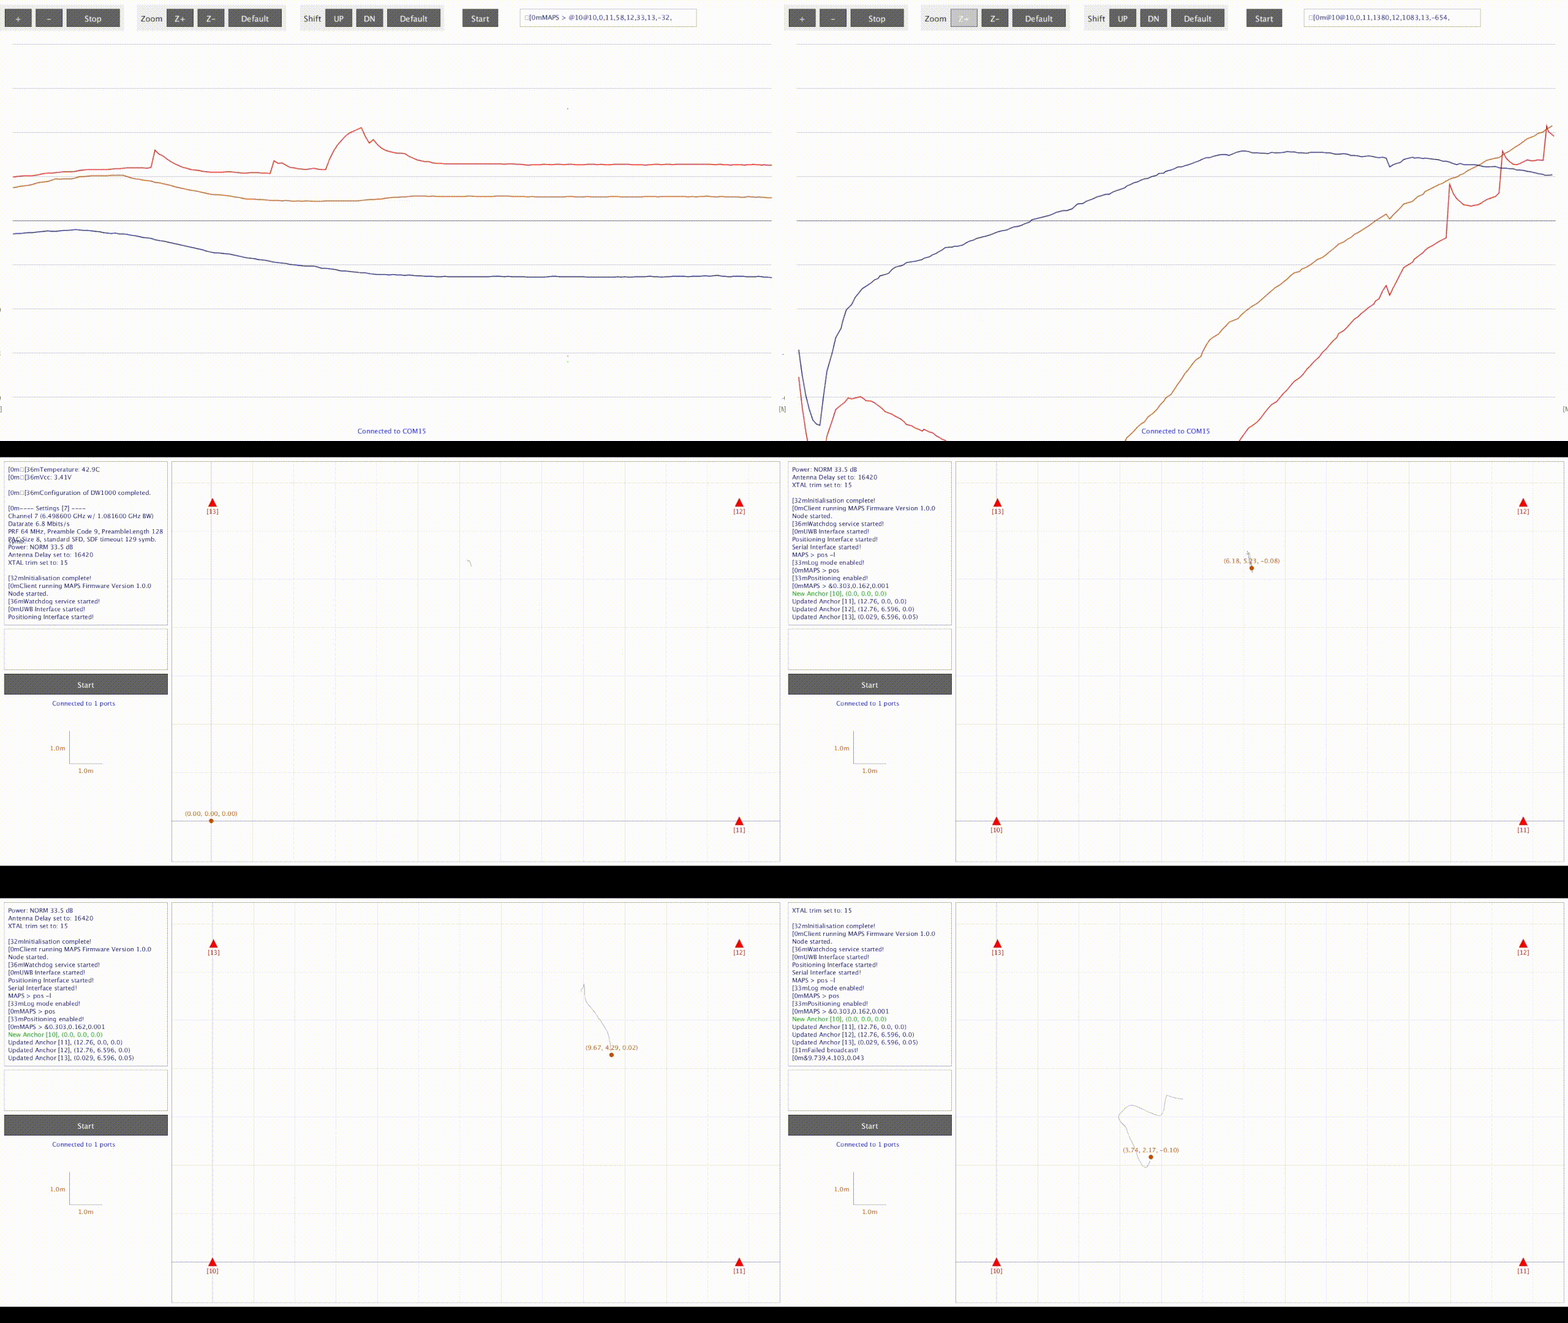
To debug the received distance differences of arrival and calculated position of the client, two user interfaces were created using Processing. One Graphical User Interface (GUI) plots only the TDoA values of the anchors and the other plots the resulting estimated position of the client.
The GUIs also support multiple devices connected to the same computer. The information of all devices are all mapped and plotted on the same map canvas but with different colors and upper ID text (in order to distinguish them). Besides that, the software also features:
- Anchor/Client position with printed individual ID
- Line collection with client path history
- Grid with scale for dimensioning
- Logger with debug information
- Start/Stop button to activate/deactivate plotting
